Redesigning discovery and access to project assets in Amazon SageMaker Unified Studio, creating a scalable inventory system so data builders can instantly find everything they've created, from one place.
Amazon SageMaker Unified Studio (SMUS) is a unified development environment where data workers can build, deploy, process, and analyze data-driven products, bringing together AWS analytics, ML, and generative AI tools under one roof.
The platform organizes work through a clear hierarchy: Domains contain Projects, and projects contain Tools, the specific AWS capabilities a team has enabled. Each tool lets builders create entities: apps, models, workflows, pipelines, and more.
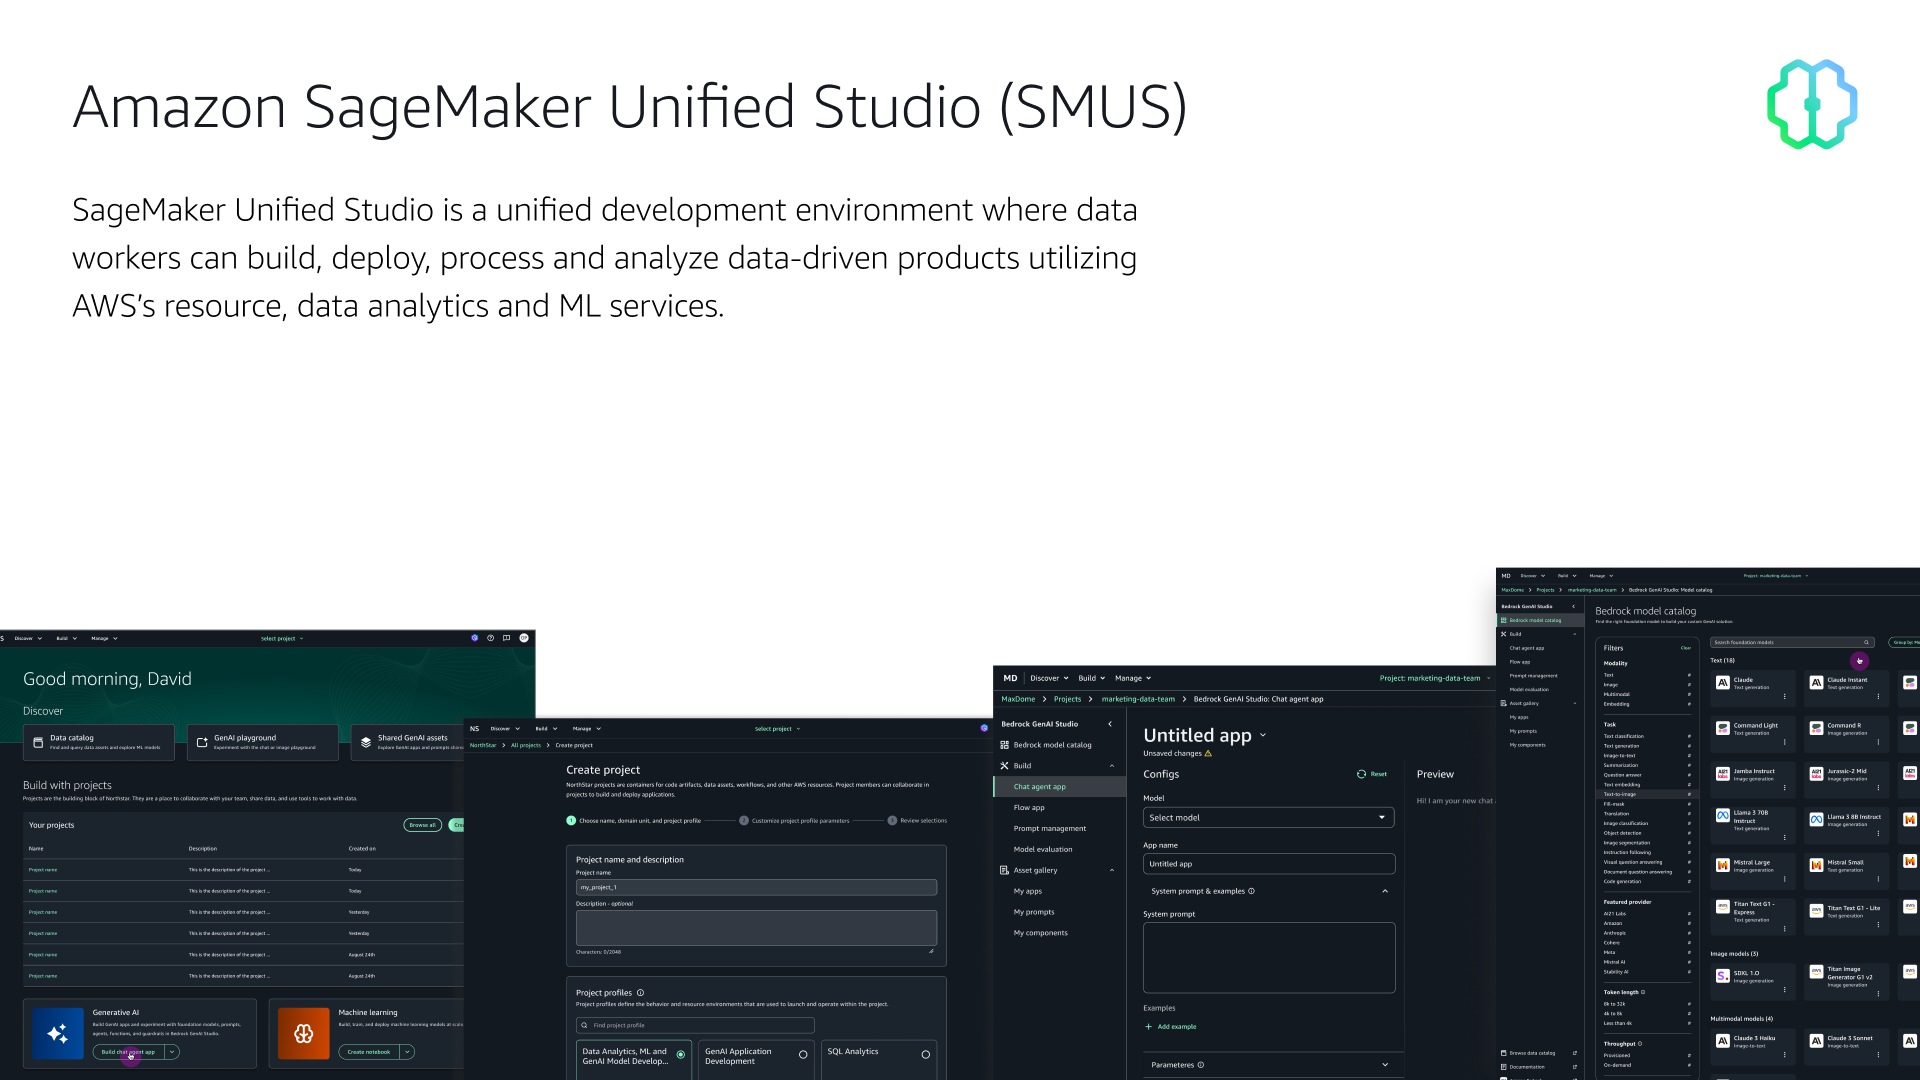
SMUS is where data teams go to do their actual work. It consolidates familiar AWS tools (Amazon EMR, Glue, Athena, Redshift, Bedrock, and SageMaker AI) into a single governed environment, so teams don't have to jump between disconnected consoles to get things done.
In practice, that means a data engineer can query a data lake, a machine learning engineer can train and deploy a model, and a GenAI builder can create a Bedrock-powered application, all from the same place, within the same project, with access to the same data.
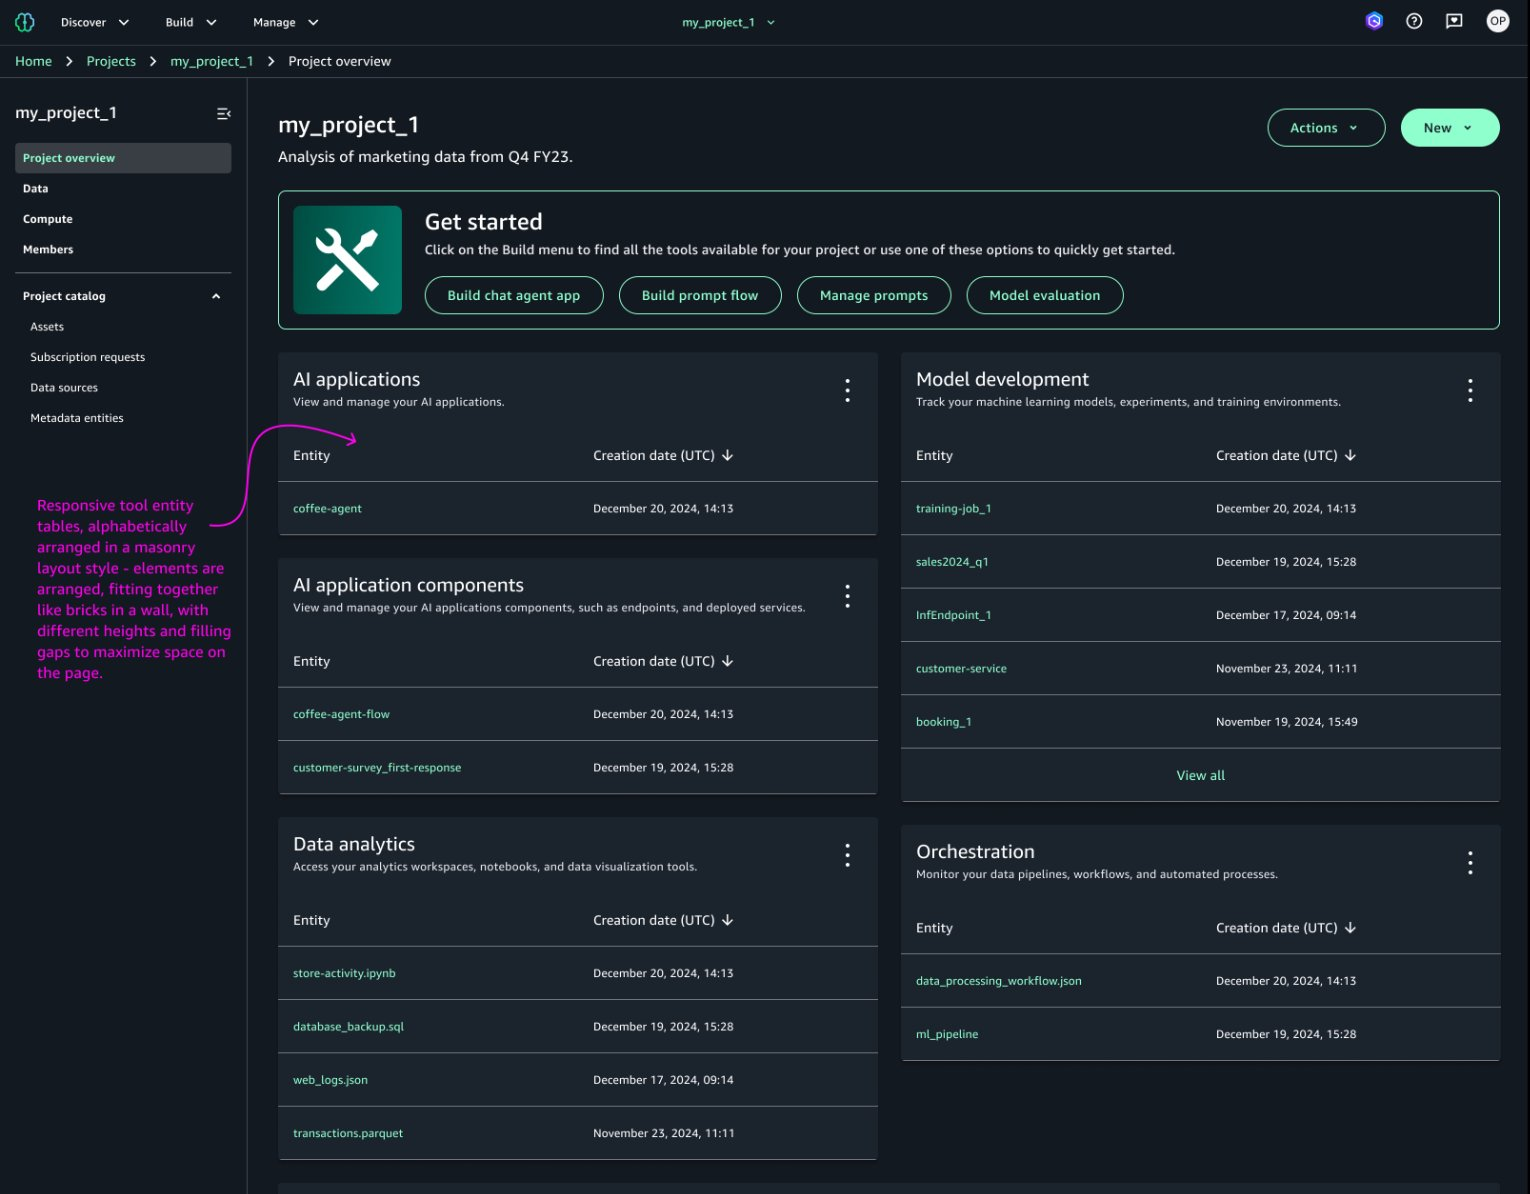
Work is organized into projects: shared spaces where team members collaborate, create artifacts, and share analytics and AI assets across the organization. Each project is scoped to a set of tools (defined by its project profile), and everything a team builds (notebooks, pipelines, prompts, models, applications) lives inside that project.
The core use cases span four areas: SQL analytics for querying and exploring data, data processing for building ETL pipelines and workflows, model development for training and deploying ML models, and generative AI for building applications powered by Amazon Bedrock. These workflows increasingly overlap, which is exactly why a unified environment exists in the first place.
Three primary builder types use the platform, each with distinct goals and key actions.
Discovers ML assets, requests access, explores shared data. Key CTAs: Discover data · ML model hub · GenAI playground.
Connects to project data, cleans and preps, builds pipelines and workflows. Key CTAs: Browse data · Create data product.
Trains ML models, builds GenAI apps from ML models. Key CTAs: ML model hub · GenAI playground · Create GenAI app.
A problem occurred when builders who had previously created entities in a project could not find those entities upon landing on the project overview page. The project creation workflow and project overview APIs prevented entities and other tool assets from surfacing at the top level, making them difficult to find.
Project entities created inside tools (Bedrock apps, workflows, ML pipelines) didn't surface on the project overview page. Users couldn't find what they built.
Local artifacts like Bedrock assets weren't visible because they weren't saved to the Git repo. Users needed visibility of both Git and local artifacts in one view.
With each new tool category added to SMUS, the problem compounds. Without a scalable entity display system, the overview page would become increasingly useless.
We simply needed a more discoverable and scalable inventory display of project entities to solve the immediate need to find and open files or assets from the overview page.
SMUS has a concept of project profiles. Projects are created from profiles, and profiles contain tool blueprints, the resources needed to run specific tools in a project.
After a project is created, members can start building entities with the tools they added as blueprints. This meant the new design would only show tool entity tables on the overview page if the project was created with those specific tool blueprints.
This profile-driven architecture became the core logic for which entity tables to surface, ensuring the UI always reflected the project's actual capabilities, not a generic template.
Across all tool categories, builders create ten distinct entity types.
| Build Category | Entity | File / Name |
|---|---|---|
| AI Applications | Chat | Chat name |
| AI Applications | Prompt | Prompt name |
| AI App Components | Function | Function name |
| AI App Components | Guardrail | Guardrail name |
| AI App Components | Knowledge base | Knowledge base name |
| Model Development | Inference endpoint | Inference point name |
| Model Development | Training job | Training job name |
| Orchestration | Workflow | Workflow name |
| Orchestration | ML Pipeline | Pipeline name |
| Data Analytics | Visual ETL | [name].vetl |
Early explorations restructured the project overview page into clearly labeled sections. The structure that emerged translated directly from builder mental models.
Studying competitor landing pages surfaced clear patterns for making recent assets quickly accessible.
Both competitors independently converged on recency and progressive disclosure - clear validation for the SMUS redesign direction.
The core design decision: only surface entity tables for tool categories that were enabled at project creation. This keeps the overview page clean and relevant, never showing empty categories that don't apply to the project.
A single table per category shows 6 entities per page with pagination, a category filter dropdown, and a "Create Entity" button always in view.
The work did more than solve a discoverability problem. It catalyzed strategic conversations about how SMUS should evolve, and influenced how engineering approached the underlying APIs.
The design sparked strategic roadmap discussions with stakeholders, resulting in resource allocation adjustments to prioritize entity visibility.
Pushed the team to restructure how artifact management worked at the API level, enabling both Git and local artifacts to surface consistently from one view.
Gained positive customer validation. The design influenced related product features across SMUS and accelerated broader UX improvements for workflow efficiency.
Understanding the project profile architecture, and how it constrained which entities were available, was essential before any UI work could begin. The design couldn't exist without deeply understanding the data model it was visualizing.
Designing for sparse states (a project with only 1 entity created) and full states (all categories populated) revealed that the biggest UX wins often happen in the in-between moments, when users first arrive and have created just a few things.
Pushing for better user visibility isn't just a UX concern. It can fundamentally reshape how engineering teams think about data architecture. The design became a catalyst for technical change, not just a UI layer on top of an old system.
Azure Databricks and Microsoft Fabric independently converged on similar patterns: recency, progressive disclosure, clear CTAs. This reflected shared mental models in data analytics platforms that we could learn from rather than reinvent.